
Track booking volume, booking pace, conversion rate, cancellation and no-show rate, capacity utilisation, revenue per slot and channel mix: these metrics tell you whether demand is healthy, whether you’re converting interest into paid bookings, and whether your calendar is earning what it should. Measure them through GA4’s key-event model for funnel and channel data, and through platform market-insights reports such as book_window and pace_report for booking-specific pacing and demand. The sections below explain how to calculate each one and turn it into a daily decision.
TL;DR:
- Use net bookings by book date, not gross counts or stay dates, for staffing and marketing; compare booking pace with last year to filter seasonality.
- Track funnel steps in GA4 and calculate completed bookings against starts by channel; many starts but few payment attempts often signal form or pricing friction.
- Separate cancellations from missed arrivals, report cancellations by count and value, and compare similar policy types; late cancellations deserve attention because refilling is harder.
- For timed venues, pair utilization with revenue per available slot and separate group bookings; occupancy alone can hide low prices, partial fills, and group effects.
- Judge promotions by net contribution against last year and a control week, then subtract cancellations; discounted bookings can lift volume while lowering total revenue.
Table of Contents
- Quick metrics checklist for booking-based businesses
- Booking volume and booking pace: reading lead time right
- Conversion metrics and the booking funnel
- Cancellations and no-shows: rates, timing and net measures
- Capacity utilisation and slot yield for timed venues
- Revenue metrics: average booking value and yield per slot
- Dashboards and reporting best practice
- Customer segmentation and behaviour analysis
- Impact of promotional campaigns on booking metrics
- Customer lifetime value related to bookings
- Integration of booking analytics with operational decisions
- Real-time alerts and automated responses based on analytics
- What operators should actually watch first
- How Riddlio brings these metrics into one dashboard
- FAQ
- Sources
Quick metrics checklist for booking-based businesses
Group your tracking by the outcome each metric reveals, not by where the data happens to live. That way a Monday morning review answers “are we healthy” quickly.
- Volume: total bookings by book date; calculate book-date-net by subtracting cancellations, and watch for sudden drops week over week.
- Pace: bookings grouped into lead-time buckets (0 to 1 day out, 2 to 7, 8 to 30, 31 to 90, 90 plus); reveals whether you’re filling early or relying on last-minute walk-ins.
- Conversion: completed bookings divided by booking starts, tracked per channel; needs event instrumentation in GA4 rather than a platform report.
- Cancellations: cancelled bookings divided by total bookings, split by value and by count; timing against the cancellation window matters as much as the rate.
- Capacity: occupied slots divided by available slots per session, day or week; a platform report metric for most booking systems.
- Revenue: total revenue divided by bookings, and total revenue divided by slots sold; the second number tells you about yield, the first about basket size.
- Attribution: share of bookings and revenue by channel; needs both event data and platform sales statistics to reconcile.
Booking volume and booking pace: reading lead time right
Booking volume on its own is a vanity number unless you separate book date from stay date. Book date tells you when someone made the reservation; stay date tells you when they’ll show up. Reporting by stay date alone hides whether today’s demand is actually strong or whether you’re just seeing a backlog of old bookings finally arriving.
Gross book-date counts include every reservation made, cancelled or not. Net book-date counts strip cancellations out, and that’s the number that should drive staffing and marketing decisions, because gross volume overstates real demand whenever cancellation rates shift.
Booking-window buckets, as used in market-insights reporting, group reservations by how far ahead they were made: 0 to 1 day, 2 to 7 days, 8 to 30 days, 31 to 90 days, and 90-plus days out, a structure drawn from Booking.com’s book_window report. A venue leaning heavily on the 0 to 1 day bucket is living hand to mouth; one with strong 31 to 90 day volume has room to plan staffing and inventory weeks ahead.
- Pace reports project future reservations and revenue based on how current bookings compare to the same point in a prior period.
- Comparing pace to last year, rather than to a flat target, filters out seasonal noise.
- A peer or competitive-set comparison, where available, shows whether a slow week is market-wide or venue-specific.
Conversion metrics and the booking funnel
A booking funnel has distinct steps, and each one deserves its own event: page view, booking started, waiver or details submitted, payment started, booking completed. Google’s guidance on marking key events in GA4 lets you flag the completed-booking event, along with waiver signatures or kiosk check-ins, as a key event so revenue and conversion reporting attach cleanly to that moment. GA4 treats conversions and ecommerce activity as events, and you can attach a monetary value as a custom event parameter so completed bookings carry their revenue into reporting.
Overall conversion rate is completed bookings divided by booking-start events. That single number hides more than it reveals, though, because channel behaviour varies enormously: a paid social visitor converts differently to someone arriving from a branded search. Calculating conversion per channel, rather than as one blended figure, is what actually informs where to spend the next marketing dollar.
- Track intermediate events (waiver signed, payment started) separately so you can see exactly where people drop off.
- A high “booking started” count with a low “payment started” count usually points to friction in the form or pricing display, not a traffic problem.
- Per-channel conversion should feed directly into campaign spend decisions, since a channel with cheap clicks and poor conversion is costing you more than it looks.
Cancellations and no-shows: rates, timing and net measures
Cancellation rate and no-show rate measure different failures. Cancellation rate is bookings cancelled divided by total bookings, usually reported both by count and by value, since a handful of large-group cancellations can do more damage than the count suggests. No-show rate is bookings that simply never arrived, with no cancellation logged at all, which is the harder problem because no warning precedes it.
Both metrics change your forecasting. A pace report built on gross bookings looks healthier than reality until you subtract cancellations, and the same applies to revenue forecasts built before the cancellation window closes. Booking.com’s performance analysis tracks cancellation rate alongside conversion and average daily rate for exactly this reason: it’s a leading indicator of revenue leakage, not just an operational nuisance.
- Filter cancellations by policy type: a flexible policy will naturally show a higher rate than a strict one, so compare like with like.
- Segment by lead time to cancellation: last-minute cancellations are harder to refill and deserve closer attention than early ones.
- Break cancellations down by channel; some third-party channels carry structurally higher cancellation rates than direct bookings.
Capacity utilisation and slot yield for timed venues
Utilisation is occupied slots divided by available slots, and the cadence you measure it at changes what it tells you. Daily utilisation catches short-term staffing problems; weekly utilisation shows whether a pricing or marketing change is working; monthly utilisation is for spotting seasonal patterns worth planning a year around.
Revenue per slot, sometimes described as yield per slot, is the number that actually matters for timed venues, because raw utilisation doesn’t account for group size or pricing tier. A session of solo bookings at a low price point can earn less than a less-full session of large groups at full price, so pairing utilisation with revenue per room gives a fuller picture than either number alone.
- Partial fills (a four-person slot booked by two) should be tracked separately from true no-shows, since they represent a pricing or minimum-group opportunity, not a failure.
- Group bookings skew both utilisation and revenue per slot upward, so report them as a distinct segment rather than folding them into averages.
- A staffing schedule tied to actual demand patterns rather than fixed shifts keeps labour cost aligned with utilisation swings.
Revenue metrics: average booking value and yield per slot
Average revenue per booking is total revenue divided by number of bookings, a simple number that still misses a lot: it blends solo bookings with large groups and ignores how full your calendar actually is. Revenue per slot, total revenue divided by slots sold, corrects for that by tying income to capacity rather than to booking count.
Timed venues can borrow the hotel industry’s ADR and RevPAR logic here. Average daily rate measures price per unit sold; revenue per available unit measures price per unit you could have sold, capacity included. The equivalent for a timed venue is revenue per available slot, which captures both pricing and fill rate in one figure, the same combination Booking.com’s performance analysis tracks through its ADR and conversion metrics.
- Report revenue net of payment processing fees, since gross figures overstate what actually lands in the bank.
- Subtract refunds and cancelled-but-paid amounts before calling a number “final” for the month.
- Keep seasonal pricing changes tagged in your reporting so a revenue-per-slot jump is attributed to the right cause.
Dashboards and reporting best practice
A dashboard earns its place only if it changes a decision. A small set of visualisations covers most operator needs: a pace curve comparing this period to last year, a booking-window heatmap showing how far out people book, a funnel chart for conversion by step, and a utilisation calendar for capacity at a glance.
Cadence matters as much as content. Check pace daily, since it’s the earliest warning of a slow week. Review utilisation weekly, when there’s still time to adjust staffing or a short-term promotion. Leave full revenue review to monthly, once cancellations and refunds have settled.
- Set a pace alert when bookings for a given date fall meaningfully behind the same point last year.
- Flag a cancellation spike when the daily rate jumps well above its rolling average.
- Use a utilisation threshold to trigger a last-minute promotion before a session goes out empty.
Customer segmentation and behaviour analysis
Booking data splits customers into groups that behave very differently, and averaging across them hides the patterns worth acting on. First-time bookers, repeat customers, large groups and corporate or event bookings each have distinct booking windows, cancellation rates and price sensitivity.
A first-time booker typically books closer to the date and is more price-sensitive, while a repeat customer books further out and responds better to loyalty-style offers than to discounts. Large groups tend to book earlier, carry higher average value, but also show higher cancellation rates because coordinating several people’s schedules is harder than one person confirming a solo slot.
Segmenting by acquisition channel adds another layer: a customer arriving through organic search behaves differently from one clicking a paid ad, often converting at a lower rate but returning more often. Layering these segments against the booking-window buckets described earlier shows which group drives your 0 to 1 day volume and which fills out the 31 to 90 day window, information that should shape how far ahead you schedule staff and promotions.
Treating reservation data as a behavioural map, rather than a simple ledger, means overlaying booking patterns with seasonality and historical demand to anticipate what’s coming rather than reacting once a slow week has already happened. A venue that notices its weekday evening slots skew toward repeat local customers, for instance, can tailor a loyalty offer to that specific segment instead of running a blanket discount that erodes margin on bookings that would have happened anyway.
- Separate first-time and repeat bookers in every core metric, since blending them flattens both insights.
- Track group bookings as their own segment given their different cancellation and value profile.
- Review channel-level behaviour alongside booking-window data to see which segment drives last-minute versus advance demand.
Impact of promotional campaigns on booking metrics
A promotion should move specific metrics in predictable ways, and measuring only total revenue during a campaign hides whether it actually worked. A well-targeted promotion lifts conversion rate and shifts the booking-window distribution toward earlier lead times, as customers lock in a discounted slot ahead of time rather than waiting. A poorly targeted one just pulls forward bookings that would have happened anyway, inflating short-term volume while leaving total revenue flat or lower once the discount is accounted for.
The cleanest way to isolate a campaign’s effect is comparing booking pace during the promotional period against the same period last year and against a non-promoted control week. A genuine lift shows up as volume above the pace trend line, not just volume above zero. Net contribution, rather than gross revenue or raw booking count, is the number that actually tells you whether a campaign paid for itself, since a discount that drives extra bookings at a reduced price can still lose money against ten bookings at full rate.
Cancellation rate deserves a watch during and after any promotion too. Heavily discounted or flash-sale bookings tend to carry higher cancellation rates than full-price reservations, since customers have less to lose. If a campaign’s apparent volume lift evaporates once cancellations are subtracted, the net-booking number, not the gross one, tells the real story.
- Compare promotional-period pace against the same period last year, not against an arbitrary flat target.
- Track cancellation rate separately for discounted bookings to see whether the lift is genuine or a mirage.
- Measure net contribution, not gross revenue, to judge whether a promotion was worth running again.
Customer lifetime value related to bookings
Lifetime value in a booking business is built from repeat visit frequency and average spend per visit, not from a single transaction. A customer who books annually at full price might be worth less over several years than one who returns more often even at a slightly discounted rate, and treating every booking as a standalone sale misses that difference entirely.
Calculating it starts simply: average revenue per booking multiplied by average number of bookings per customer over a given period. The harder, more useful work is segmenting that calculation by acquisition channel and by customer type, because a corporate or group booker often returns on an annual cycle tied to events, while an individual enthusiast might return every few months. Blending those patterns into one lifetime-value figure makes retention efforts harder to target.
This connects directly back to the segmentation and promotional analysis above. If a discount-driven campaign brings in customers who never return, its apparent short-term win looks very different once measured against the lifetime value of customers acquired through word of mouth or repeat-booking incentives. Tracking repeat booking rate, the share of customers who book more than once over a chosen period, alongside average spend per visit gives a practical, ongoing proxy for lifetime value without needing a complex model.
- Calculate lifetime value as average revenue per booking multiplied by average bookings per customer over a set period.
- Segment the calculation by acquisition channel, since channels differ in how often they produce repeat bookers.
- Track repeat booking rate as a simpler, ongoing proxy when a full lifetime-value model isn’t practical.
Integration of booking analytics with operational decisions
Metrics that sit in a dashboard and never reach a staffing roster or a pricing sheet aren’t doing their job. The point of tracking booking pace, utilisation and conversion is to feed decisions that happen days or weeks later, not just to populate a monthly report.

A pace report showing a soft week two weeks out should trigger a staffing adjustment before that week arrives, not an after-the-fact explanation of why revenue was down. Similarly, a utilisation pattern showing consistent under-filling on weekday afternoons is a direct input into a demand-based staffing schedule, rather than a number reviewed once a month and forgotten.
Revenue-per-slot data should flow into pricing decisions on a similar loop: a sustained gap between weekday and weekend yield is the signal to test a seasonal or peak pricing structure rather than leaving pricing static year-round. The operators who get the most out of their analytics are the ones who’ve built a short, repeatable path from metric to action: pace drops, staffing adjusts; utilisation lags, a promotion goes out; conversion dips on a channel, spend shifts away from it.
- Tie pace reporting directly to a staffing decision point, ahead of the date in question.
- Use sustained utilisation gaps as the trigger for a pricing review rather than waiting for an annual pricing cycle.
- Route channel-level conversion drops into a marketing spend reallocation within the same reporting week.
Real-time alerts and automated responses based on analytics
Daily or weekly dashboard reviews catch slow-building trends well, but some problems need a faster response than a scheduled check-in allows. A sudden cancellation spike on a specific date, a payment failure pattern, or a channel’s conversion rate collapsing overnight are all situations where waiting for Monday’s review costs revenue.
Real-time alerting works best when it’s tied to a threshold, not a raw number: flag when cancellation rate on a given date crosses a set percentage above its rolling average, or when a session’s utilisation is still low close to the slot. An automated response, rather than just a notification, closes the loop faster: a last-minute discount offer triggered automatically when a slot looks likely to go empty, or an automated reminder sent when payment is started but not completed, recovers bookings a human reviewing a weekly report would miss entirely.
The goal isn’t alerting for its own sake. Every threshold should map to a specific action someone will actually take, whether that’s a staffing text, a pricing tweak or a follow-up message, because an alert nobody acts on is just noise with extra steps.
- Set a cancellation-rate threshold relative to the rolling average, not a fixed number, so it adapts to your venue’s normal variation.
- Trigger automated last-minute offers when a slot’s utilisation remains low within a defined window before the session.
- Pair every alert with a predefined action so the system drives a response, not just a notification.
What operators should actually watch first
If you can only check a few numbers each morning, make them pace against last year, near-term utilisation, and conversion rate by channel: together they tell you whether demand, fill rate and marketing spend are all pointed the right way. Everything else in this list matters, but those three catch problems early enough to still fix them. Measurement only earns its keep when it leads somewhere, a staffing change, a pricing tweak, a reallocated ad dollar, within the same week the data appeared.
— Iosif Beraru
How Riddlio brings these metrics into one dashboard
We built our platform around the idea that booking management, payment processing and operational analytics belong in one place, not three disconnected tools you have to reconcile by hand. Booking, payment and operational analytics are brought together in one platform, helping operators monitor performance and make informed decisions.
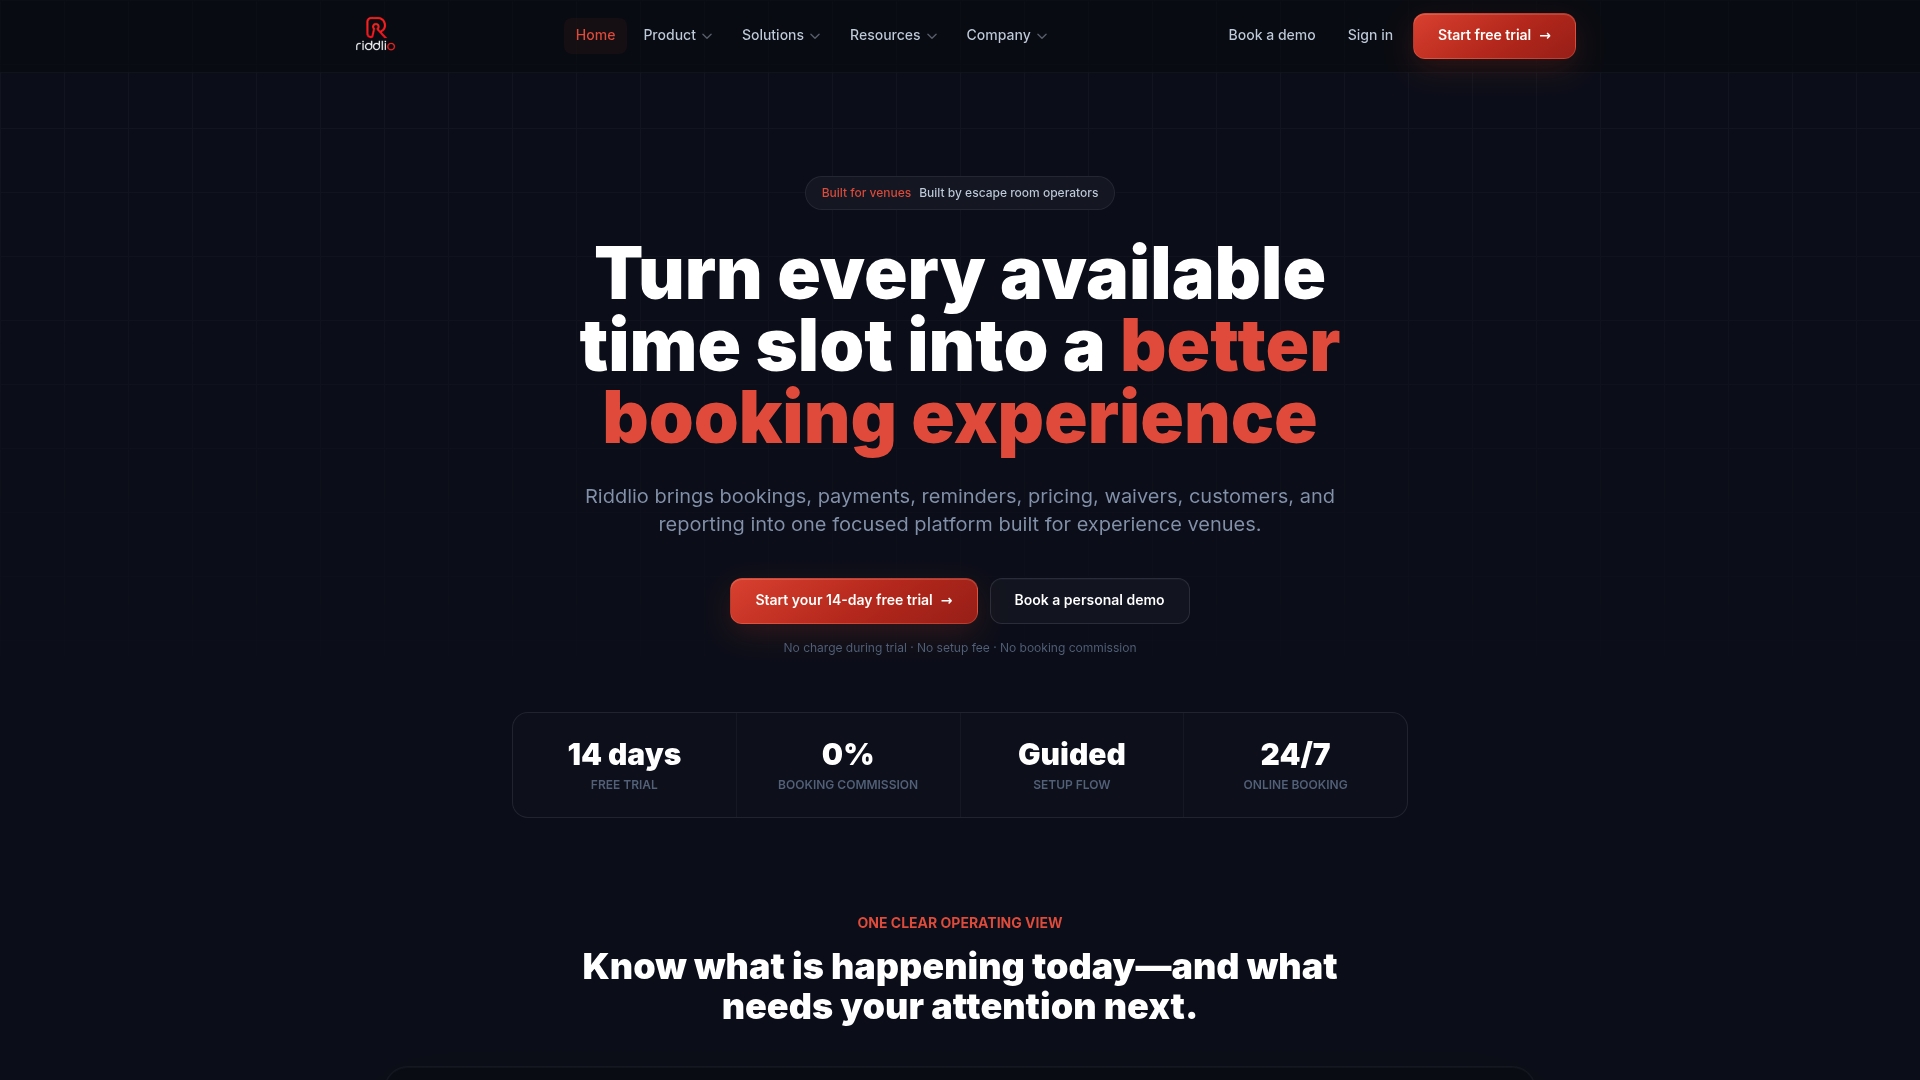
We designed this specifically for escape room venues, with tools to support booking management and venue operations. Our pricing page outlines the Starter, Pro, Unlimited and Enterprise plans, and our booking software overview shows how the analytics, calendar and payment pieces fit together if you’re ready to see it running against your own calendar.
FAQ
What are the top booking analytics tools operators use?
Most operators combine a web analytics platform, typically Google Analytics 4 for funnel and channel data, with a booking-specific platform’s own reporting for pace, utilisation and sales statistics. The right combination depends on whether you need marketing attribution, operational scheduling data, or both together in one dashboard.
What percentage does Booking.com take from bookings?
Commission structures are set out in each property’s partner agreement and vary by market and contract terms, so there’s no single universal rate to quote. Check your own Booking.com partner account or agreement for the figure that applies to your listing.
What should I check before relying on a channel’s booking performance data?
Confirm the reporting period matches between gross and net figures, since a book-date-gross number and a stay-date-net number from the same channel can look very different for the same week. Also check whether cancellations and no-shows are already excluded, as market-insights reporting offers both gross and net views depending on what you select.
What are key events in Google Analytics?
Key events are specific user actions, such as a completed booking or a submitted waiver, that you flag in GA4 so they’re tracked as conversions and can carry a monetary value. You can mark events already received by GA4 as key events, with some marked by default and room to add further ones in a standard property.
Sources
Two data sources cover almost everything above: GA4’s event model for funnel and channel behaviour, and platform market-insights reports for booking-specific pacing and sales. GA4 lets you mark received events as key events, with some marked by default and room to add others, standard properties allow up to 30 extra key events, so booking completion, waiver signature and payment success should all be flagged.
On the platform side, Market insights reporting returns book_window, pace_report and sales_statistics data, with sales statistics available as book-date-gross, book-date-net or stay-date-net views depending on what question you’re answering.
- Support
- Guide on using the performance analysis tool | Booking.com for Partners
- Understanding the Market insights reports