Revenue per room is the income a single escape room generates over a set period, bookings, add-ons and vouchers included, measured against that room’s available hours. It matters more than total venue revenue because it separates two things that get blurred together too often: how well a room is priced and how well it’s utilised. This isn’t hotel RevPAR. It’s a room-hour yield number, and for multi-room venues, it’s the clearest signal you have of which spaces are pulling their weight.
TL;DR:
- Revenue per available room-hour is the most reliable KPI because it accounts for underutilisation and cannot be inflated by discounting alone.
- Weekly reports should track bookings per room, room-hour yield, utilisation by daypart, and no-show rates to identify problems early.
- Raising prices based on demand patterns and offering weekday corporate events can significantly boost revenue without increasing session volume.
- Marketing improvements, such as updating booking page photos and copy, often yield faster results than redesigning rooms or puzzles.
- Automated tools that monitor room performance and reduce no-shows, starting at $29 a month, help operators optimize yield without manual spreadsheet work.
Table of Contents
- What is revenue per room and which formulas matter?
- How do you calculate revenue per room? A worked example
- Why do some rooms in the same venue earn twice as much?
- What actually moves revenue per room upward?
- How should you account for labour, refresh costs and deposits?
- What should a weekly per-room report include?
- The habit that separates operators who scale from operators who guess
- Measuring revenue per room without the manual spreadsheet work
- Sources
- FAQ
What is revenue per room and which formulas matter?
Revenue per room adds up everything a single room earned in a period: ticket sales, add-ons, redeemed vouchers, minus refunds. Divide that by the number of sessions or hours the room was open for business, and you get a number you can compare week to week, room to room, venue to venue.
The formula that actually resists gaming is revenue per available room-hour, an escape-room analogue to the hospitality metric RevPASH. It’s calculated as total room revenue divided by available room-hours in the period, and industry KPI guidance treats it as the single best yield number because it can’t be inflated by discounting alone. A room that sells cheap tickets to fill every slot looks fine on raw revenue but ugly on room-hour yield.
Track these alongside it:
- Utilisation rate: booked hours divided by available hours, by day and by daypart.
- Bookings per room per week: a direct volume signal, independent of price.
- Average players per booking: tells you whether you’re filling capacity or just filling slots.
- No-show rate: silently eats revenue that looks “booked” on paper.
Pull bookings-per-room and no-show data from your booking system first. They’re the fastest diagnostics, and they feed every other number on this list.
How do you calculate revenue per room? A worked example
Start with five inputs: sessions run, average ticket price, average group size, add-on revenue, and hours the room was open. Everything else is arithmetic.
Say a room runs 4 sessions a day, 6 days a week, with an average group of 4 players at $35 per ticket, roughly in line with reported industry ticket price averages. Add $8 per booking in photo and merchandise upsells. The room is open 8 hours a day.
| Input | Value |
|---|---|
| Sessions per day | 4 |
| Days open per week | 6 |
| Ticket price | $35 |
| Average group size | 4 |
| Add-on revenue per booking | $8 |
| Hours open per day | 8 |
- Revenue per session: (4 × $35) + $8 = $148
- Sessions per week: 4 × 6 = 24
- Weekly revenue: 24 × $148 = $3,552
- Monthly revenue (4.3 weeks): roughly $15,274
- Available room-hours per week: 8 × 6 = 48
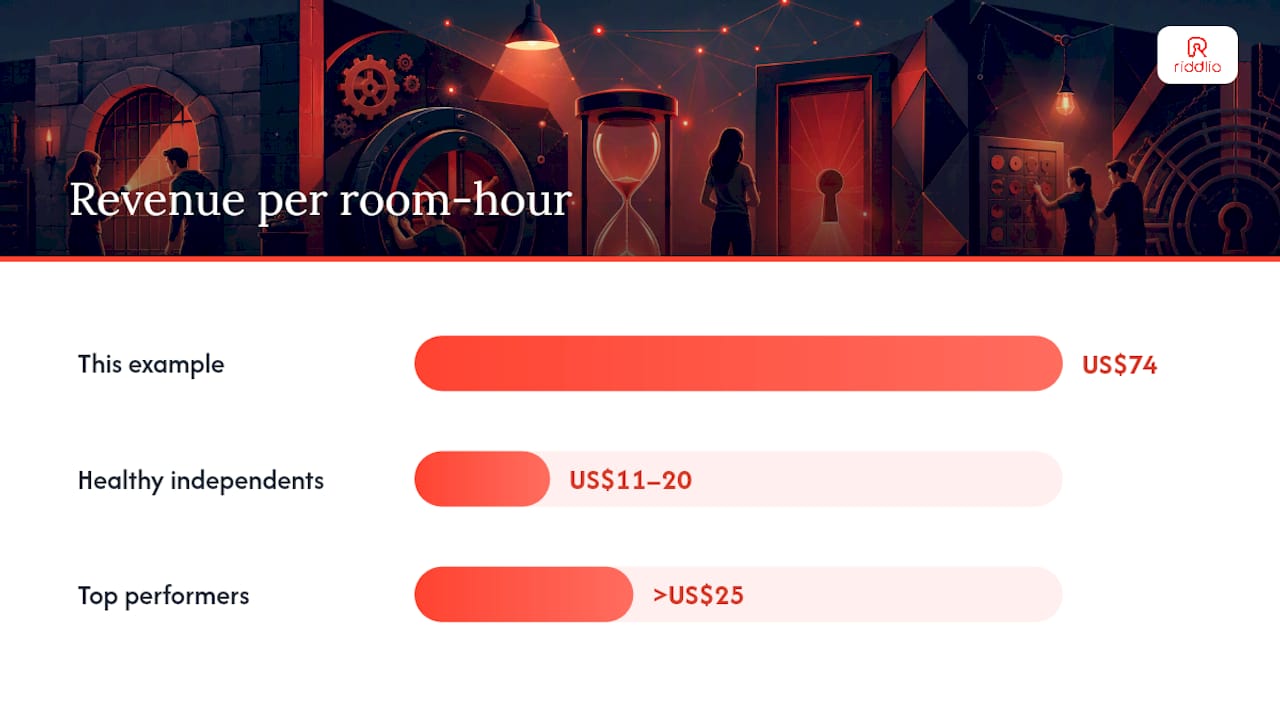
- Revenue per available room-hour: $3,552 ÷ 48 = $74
That $74 figure sits well above the RevPASH ranges for healthy independent venues, which run roughly US$11 to US$20, with top performers above US$25. The gap exists because that benchmark is calculated against every open hour including slow dayparts, not just the peak slots used in this example. Run your own room-hour figure across a full week, not a cherry-picked evening, before comparing yourself against it.
Why do some rooms in the same venue earn twice as much?
A 2x spread in revenue between rooms in the same building is common, and it rarely means one room is structurally broken. Usually it’s booking-page presentation or theme appeal doing the damage, not the physical space.
Work through these in order:
- Check the booking-page listing first. Photos, room descriptions and positioning on the page influence conversion before a customer ever sees the room. A weak listing on a great room will underperform a strong listing on an average one.
- Break down utilisation by daypart. A room that’s dead on weekday afternoons but packed Friday nights doesn’t have a demand problem, it has a scheduling and pricing problem.
- Look at group and corporate mix. Rooms that skew private-party friendly often carry higher average tickets than rooms booked mostly by casual walk-ins.
- Check operational signals: win/completion rate, reset time between sessions, and which game master is rostered on. A room with a slow reset time loses bookable hours every single day.
- Run a short test. Swap booking-page photos for two weeks, or shift a low-performing room’s pricing by daypart, and measure the room-hour yield change before and after.
Pro Tip: Before you touch the theme or the room build, test the booking page. Improving photos and copy is a two-day fix; redesigning a puzzle room is a two-month one, and it’s often not the actual problem.
What actually moves revenue per room upward?
Pricing is the fastest lever, but it only works when it’s tied to actual demand patterns rather than a flat rate applied across the whole week.
- Daypart and group-size pricing. Raise prices on Friday and Saturday evenings, lower them on Tuesday afternoons, and add a per-person surcharge for groups above your standard capacity. Dynamic pricing rules built around these three variables tend to shift more revenue than a blanket price increase.
- Corporate, school and private events on weekdays. These fill dead dayparts without competing against your weekend leisure traffic, which is where most venues already sell out.
- Upsells at the point of booking. Photo packages, extra time, merchandise and gift vouchers all add margin without adding a single extra session.
- Reduce reset time between sessions. Every ten minutes shaved off a reset is another room-hour you can sell that week.
- Automate booking reminders. No-shows are lost revenue that still occupies a slot on your calendar; cutting them recovers hours you’ve already marketed.
- Match staffing to actual demand curves, not to a flat roster, so game masters aren’t idle during slow hours or stretched thin during peak ones.
Pro Tip: Test one lever at a time. Change pricing and add-ons in the same week and you’ll never know which one moved the number.
How should you account for labour, refresh costs and deposits?
A high revenue-per-room figure means nothing if labour and refresh costs quietly eat the margin behind it. Three things belong in every operator’s bookkeeping routine, not just the sales report.
- Allocate game-master hours to the room they worked, not to the venue as a whole, so you can calculate revenue per labour hour alongside revenue per room-hour.
- Budget a room refresh reserve. Bookkeeping guidance for escape room operators recommends planning for roughly 8 to 12 percent of room revenue annually toward depreciation and refresh, and treating it as a real, recurring cost rather than a someday expense.
- Treat deposits and vouchers as deferred revenue under ASC 606 until the session is actually delivered, not the moment the payment clears.
- Watch sales tax timing on prepaid vouchers separately from redemption, since the two events can fall in different reporting periods.
What should a weekly per-room report include?
A weekly routine keeps yield problems from becoming quarterly surprises. Update these per room, every week:
- Revenue, direct labour, reset costs and depreciation share. This is your real per-room profit picture, not just top-line revenue.
- Deferred revenue movement. Track vouchers sold versus vouchers redeemed so your books and your bank balance don’t drift apart.
- Bookings per room per week. Healthy independent venues run roughly 18 to 28 bookings per room per week; under 12 is a marketing problem, not a pricing one.
- Room-hour yield and utilisation by daypart. A dip here before a dip in total revenue is your earliest warning.
- No-show rate and average group size. Both move fast and both are fixable within a week.
Set trigger thresholds now, not after a bad month. Bookings under 12 per week triggers a marketing push. A room-hour yield dip triggers a pricing or daypart test before you touch anything else.
The habit that separates operators who scale from operators who guess
Tracking revenue per room forces decisions you’d otherwise avoid: which room gets the refresh budget first, which daypart needs a price cut instead of a marketing spend, whether a game master’s schedule is actually costing you bookable hours. Total venue revenue hides all of that. Room-level numbers don’t let you look away from a room that’s quietly losing money while another carries the whole building.
— Iosif Beraru
Measuring revenue per room without the manual spreadsheet work
Most of the calculations in this article, room-hour yield, utilisation by daypart, bookings per room per week, are only useful if you can see them without building a spreadsheet every Sunday night. An analytics dashboard breaking revenue, utilisation and no-show rate down by individual room and time slot is useful for escape-room venues.

Reporting tools often pair with features like dynamic pricing rules by daypart and group size, automated SMS reminders to reduce no-shows, and payment processing that manages deposits and vouchers. It’s a flat monthly fee with no booking commission, unlike platforms that take a cut of every ticket you sell. Plans start at $29 a month on the Starter tier, scaling up to Pro, Unlimited and Enterprise as your room count and reporting needs grow. If you’re ready to see your own room-hour yield instead of estimating it, review the online booking calendar and pricing features and start a trial.
Sources
Room-hour yield methodology and benchmarks draw on PulseRevOps KPI guidance, Beancount.io’s bookkeeping and RevPASH guides, and RoomEscapeArtist’s industry report.
- Escape Room Bookkeeping: ASC 606 Deferred Revenue, QIP Cost Segregation, and the RevPASH KPIs Independent Operators Track
FAQ
What is revenue per room in an escape room business?
It’s the total income, bookings, add-ons and vouchers, a single physical room generates over a chosen period, usually measured against its available hours rather than just calendar days.
How is revenue per available room-hour different from total room revenue?
Revenue per available room-hour divides room income by every hour the room was open for business, not just the hours it was booked, which exposes underutilisation that raw revenue figures hide.
What is a healthy RevPASH range for an escape room?
Healthy independent venues typically fall between US$11 and US$20 per available room-hour, with top-performing tourist-area venues exceeding US$25.
How many bookings per room per week should I expect?
Bookkeeping guidance for the industry puts a healthy range at roughly 18 to 28 bookings per room per week; fewer than 12 usually signals a booking-page or marketing problem.
Does Riddlio track revenue per room automatically?
Riddlio’s analytics dashboard reports revenue, utilisation and booking performance by individual room and time slot, so operators can monitor room-hour yield without building manual reports.