The right way to measure campaign ROI for bookings is (Net Revenue − Campaign Cost) / Campaign Cost × 100, using revenue net of commissions, discounts and fees, not gross booking value. Before you spend another dollar, connect your booking feed to your analytics platform and decide your attribution method. Everything else in this guide builds from that one decision.
TL;DR:
- Connecting your booking feed to your analytics platform and choosing the right attribution model are crucial steps before launching a campaign to ensure accurate ROI measurement.
- Using multiple attribution models simultaneously, such as multi-touch and marketing mix modeling, helps build a more reliable picture of what drives bookings.
- Calculating net revenue contribution by deducting OTA commissions, fees, discounts, and labor from gross bookings prevents inflated ROI figures based on misleading gross revenue data.
- Focusing on operational strategies like dynamic pricing, reminder systems, and direct booking incentives can significantly improve actual booking ROI beyond advertising spend.
- Monitoring actual confirmed bookings against campaign costs and deductions often reveals a much lower ROI than gross booking figures suggest, guiding smarter scaling decisions.
Table of Contents
- What is the campaign ROI formula for bookings?
- Which attribution model should you trust for bookings?
- How do you set up tracking before you launch a campaign?
- How do you calculate net revenue contribution for bookings?
- How should you read Channel Performance and Performance Max reports?
- What actually moves the needle on booking ROI?
- What does a worked booking ROI example look like?
- What booking measurement gets wrong most often
- Where to go for deeper reading on campaign ROI
- Sources
What is the campaign ROI formula for bookings?
The standard marketing ROI formula is (Revenue − Cost) / Cost × 100, and it applies directly to bookings once you swap “revenue” for booking-derived revenue rather than page views or leads. AnyRoad’s formula gives you a clean starting point: spend $2,000 on a campaign, generate $8,000 in bookings, and your ROI reads 300%. HubSpot runs a near-identical calculation in its own reporting tools, using ((attributed revenue or deal value − campaign spend) / campaign spend) × 100, though it flags that the number shown depends heavily on which attribution model and revenue metric you’ve selected. Two marketers looking at the same campaign can see wildly different ROI figures purely because of a settings toggle.
ROI and ROAS get confused constantly, and the difference matters more than most dashboards let on. ROAS tells you revenue per dollar spent; ROI tells you profit per dollar spent after costs. Oracle’s breakdown of marketing ROI makes the case for tracking several ROI types simultaneously rather than picking one: revenue and bookings, cost-per-acquisition ratio, sales cycle length, and customer lifetime value.
For booking businesses, that translates into a specific KPI set:
- Bookings — the raw count of confirmed reservations attributed to the campaign
- Conversion rate — visits or clicks that turn into completed bookings
- Cost per acquisition (CPA) — total spend divided by bookings generated
- Customer lifetime value (CLV) — projected revenue from a booker across repeat visits or referrals
- Average daily rate (ADR) and revenue per available room/slot (RevPAR) — relevant if you’re managing timed inventory like rooms, tables or session slots
- Direct booking share — the portion of bookings coming through your own channels versus third-party platforms
- Cancellation rate — bookings that never convert to actual revenue
Which of these you lead with depends on what the campaign is actually for. A brand awareness push should be judged on booking volume and direct booking share, not CLV, because it hasn’t run long enough to prove retention. A loyalty or remarketing campaign is the opposite: CLV and repeat booking rate matter more than the initial CPA.
Which attribution model should you trust for bookings?
None of them, on their own. That’s the uncomfortable truth most campaign dashboards don’t want you to sit with, and it’s why the smartest booking-focused marketers run more than one model at the same time.
Last-touch attribution credits whichever channel got the final click before a booking. It’s simple, it’s what most ad platforms default to, and it systematically overvalues bottom-funnel channels like branded search and retargeting while starving the awareness campaigns that started the journey. If you’ve ever wondered why your remarketing ads always look like your best performer, this is why.
Multi-touch attribution (MTA) spreads credit across every touchpoint in the booking journey, giving a more honest picture of how awareness, consideration and conversion channels work together. It’s the right default for everyday budget decisions because it reflects how bookers actually behave: they see a social ad, search your brand name a week later, then click an email reminder before booking.
Marketing mix modelling (MMM) takes a step back from individual touchpoints and looks at aggregate spend against aggregate outcomes over time, using statistical modelling rather than tracking pixels. It’s useful precisely because it doesn’t rely on cookies or click data, which makes it a solid check on channel-level attribution when privacy restrictions limit what MTA can see.
Incrementality testing, using holdout groups, is the only method of the four that proves causation rather than correlation. You withhold a campaign from a defined audience segment, measure the booking gap against the group that saw it, and you get a real answer to “did this campaign cause bookings, or did those people book anyway?” Sojern’s destination marketing framework treats incrementality testing as one layer among several, alongside exposure-to-arrival tracking and brand lift studies, precisely because no single method tells the whole story.
Here’s the practical sequence worth running:
- Use multi-touch attribution for weekly and monthly budget calls, because you need speed and a reasonably accurate directional read.
- Run marketing mix modelling quarterly if you’re spending across enough channels for it to be statistically meaningful.
- Schedule at least one well-powered incrementality test per year, sized to detect your expected uplift, to validate whether your everyday attribution model is telling the truth.
- Reconcile discrepancies between the three by weighting more recent, larger-sample data over anecdotal spikes.
Pro Tip: Don’t wait for a “big enough” moment to run your first holdout test. A two-week test on a single geographic region or one email segment is enough to start calibrating your attribution model against reality, and it costs almost nothing compared to a full campaign.
Layering methods rather than choosing one is the difference between a dashboard that looks confident and one that’s actually right.
How do you set up tracking before you launch a campaign?
Get your instrumentation right before spend goes live, because retrofitting attribution onto three months of untracked bookings is close to impossible. The setup work isn’t glamorous, but it’s the difference between a campaign report you can trust and one you’re guessing at.
Start with these non-negotiables:
- Integrate your booking platform’s data feed directly into your analytics and CRM systems, so bookings show up as conversions, not just as line items in a separate spreadsheet.
- Map every booking ID to the UTM parameters or click ID that generated it, so you can trace a confirmed reservation all the way back to the ad, email or post that started it.
- Set up conversion events for each stage that matters: booking started, booking confirmed, payment completed, and (where relevant) upsell accepted.
- Upload offline conversions where bookings happen by phone or in person, so those don’t vanish from your attribution model entirely.
- Build an automated reconciliation check between your ad platform’s reported conversions and your booking system’s confirmed count, because double counting between platforms is one of the most common (and least discussed) sources of inflated ROI figures.
- Define your holdout group size and test window before the campaign launches, not after you notice the numbers look odd.
HubSpot’s own documentation is a useful reminder here: the ROI figure a platform shows you is only as good as the attribution settings and revenue definitions behind it. Get those wrong at setup and every report downstream inherits the error.
A properly instrumented immersive experience booking system can separate activity metrics, audience response and financial impact automatically, which removes a lot of the manual reconciliation work venues otherwise do in spreadsheets.
Pro Tip: Run a test booking through your full funnel, ad click to confirmation email, before launch day. If the UTM data doesn’t survive the journey to your CRM, no amount of campaign spend will fix a broken measurement chain.
How do you calculate net revenue contribution for bookings?
Gross booking revenue lies to you, and it does so consistently in the same direction: upward. A campaign that drives $10,000 in gross bookings can look brilliant until you subtract everything that comes out before that money is actually yours.
The deductions that matter most:
- OTA commissions — third-party booking platforms typically take a cut before you see a cent, and that cut varies significantly by platform and contract
- Payment processing fees — a percentage plus a fixed fee on every transaction
- Discounts and promo codes — the campaign-specific incentive that got someone to book in the first place
- Agency or platform fees — management costs tied to running the campaign itself
- Creative production costs — photography, video and design spend attributed to that specific push
- Labour — staff time spent on booking confirmations, customer service and campaign administration
The micro-formula per booking looks like this: Net Contribution = Gross Booking Value − (Commission + Payment Fees + Discount + Allocated Labour). Aggregate that across every booking a campaign generated, subtract total campaign spend, and divide by campaign spend to get a genuinely honest ROI figure.
This is where a lot of otherwise competent marketers get caught out. A campaign showing 400% ROAS on gross bookings can quietly turn into a 40% net loss once OTA commissions, a 20% discount code and processing fees are stripped out. High traffic or a flashy ROAS number can mask real margin erosion, which is exactly why net contribution per booking, not raw revenue, needs to be the number that goes in front of stakeholders.
Refunds, cancellations and no-shows need the same treatment. If a booking cancels within a refund window, it should be removed from the revenue side of the equation entirely for that reporting period, not just flagged as an asterisk. No-shows are trickier: if you’ve charged a deposit or full payment upfront, that revenue stays real even if the seat goes empty, but if you operate a pay-on-arrival model, a no-show is a booking that generated cost (marketing spend, admin time) with zero return. Track both categories separately so a spike in no-shows doesn’t get buried inside your headline ROI figure.
How should you read Channel Performance and Performance Max reports?
Google’s channel performance reporting for Performance Max finally opened up visibility into where PMax actually spends your budget, breaking it down across Search, YouTube, Display, Discovery, Gmail and more. Before this rolled out, PMax was effectively a black box, and plenty of advertisers were unknowingly funding what amounted to a Search campaign wearing a different label.
If your channel report shows Search absorbing most of the spend, that’s a signal worth acting on rather than ignoring. Running separate, dedicated Search campaigns alongside a leaner PMax allocation gives you back keyword-level bid control and clearer attribution, instead of leaving everything to an automated black box that may be chasing branded search traffic you’d have captured anyway.
A few practical notes on using these reports:
- Cross-reference Channel Performance data against GA4 and your booking feed, because ad-platform conversion counts and actual confirmed bookings rarely match exactly.
- Export the raw data rather than relying solely on the native dashboard visuals. Search Engine Land’s review of the Channel Performance report notes that its Sankey diagram and summary tables leave out ratios like conversion rate and cost-per-conversion, which you’ll need to calculate manually in a spreadsheet.
- Reconcile mismatches by checking timestamp windows first. A conversion window difference between GA4 and Google Ads is one of the most common causes of numbers that don’t add up.
- Treat any single-platform “ROI” figure as provisional until it’s checked against your actual booking system data.
Pro Tip: Export your Channel Performance data monthly rather than checking the live dashboard. The native view updates and reshuffles attribution retroactively, which makes month-over-month comparisons unreliable unless you’re working from a saved snapshot.
What actually moves the needle on booking ROI?
Most of the ROI gains available to booking businesses don’t come from bigger budgets. They come from redirecting the budget you already have and tightening the operational gaps that quietly bleed margin.
Start with bidding and allocation:
- Shift ad platform bidding strategies to optimise for booking value rather than raw click volume or lead count, since a $200 booking and a $20 booking shouldn’t be treated as equally valuable conversions.
- Pull spend away from channels showing a high CPA relative to CLV, even if their raw conversion count looks respectable on a dashboard.
- Split blended campaigns into separate ones by intent, high-intent branded search versus broad awareness display, so budget decisions aren’t averaged across fundamentally different jobs.
- Reallocate a portion of retargeting budget toward lookalike audience expansion once your core segment shows signs of saturation (rising CPA, falling incremental lift in holdout tests).
Creative and audience work matters just as much as the media buying side. Messaging tailored to booking intent, “available this weekend” versus a generic brand awareness line, consistently outperforms generic creative because it matches where the booker actually is in their decision. Remarketing to people who started a booking but didn’t finish it is one of the highest-ROI segments available to almost any booking business, but it needs a light touch: hitting the same abandoned booker with six ads in three days pushes people toward the competitor with the least aggressive retargeting, not toward you.
The commercial levers outside the ad platform often deliver more ROI improvement than anything inside it:
- Dynamic pricing that adjusts rates based on demand and remaining slot availability captures revenue you’d otherwise leave on the table during peak windows, and can smooth demand into slower periods through targeted discounting. A dynamic pricing setup built for timed inventory makes this adjustment automatic rather than manual.
- SMS and email reminders sent ahead of a booking measurably reduce no-shows, which directly protects the net revenue side of your ROI calculation. Structured reminder sequences are worth building as a standard part of your booking flow, not an afterthought.
- Minimum deposit requirements on bookings reduce the financial exposure from no-shows, since even a partial payment converts an empty slot from pure loss into partial revenue.
- Reducing OTA dependence by investing part of your campaign budget in direct booking incentives protects margin long term, since every OTA-routed booking carries a commission that a direct booking doesn’t.
None of these tactics work in isolation. A dynamic pricing model without reminder-driven no-show reduction just means you’re charging more for slots that still go empty. The compounding effect, better pricing, fewer no-shows, less OTA leakage, is where the real ROI improvement shows up over a full quarter, not a single campaign.
What does a worked booking ROI example look like?
Take a campaign that spends $3,000 and generates 50 confirmed bookings at an average gross value of $120 each, for $6,000 in gross booking revenue. Before celebrating a 100% ROAS, run the deductions: a 15% OTA commission on 20 of those bookings ($360), payment processing fees averaging 3% across all bookings ($180), and a 10% promo discount applied to 15 bookings ($180). That’s $720 in deductions, leaving $5,280 in net revenue. Three of the 50 bookings cancelled within the refund window, removing a further $360, bringing net contribution to $4,920.
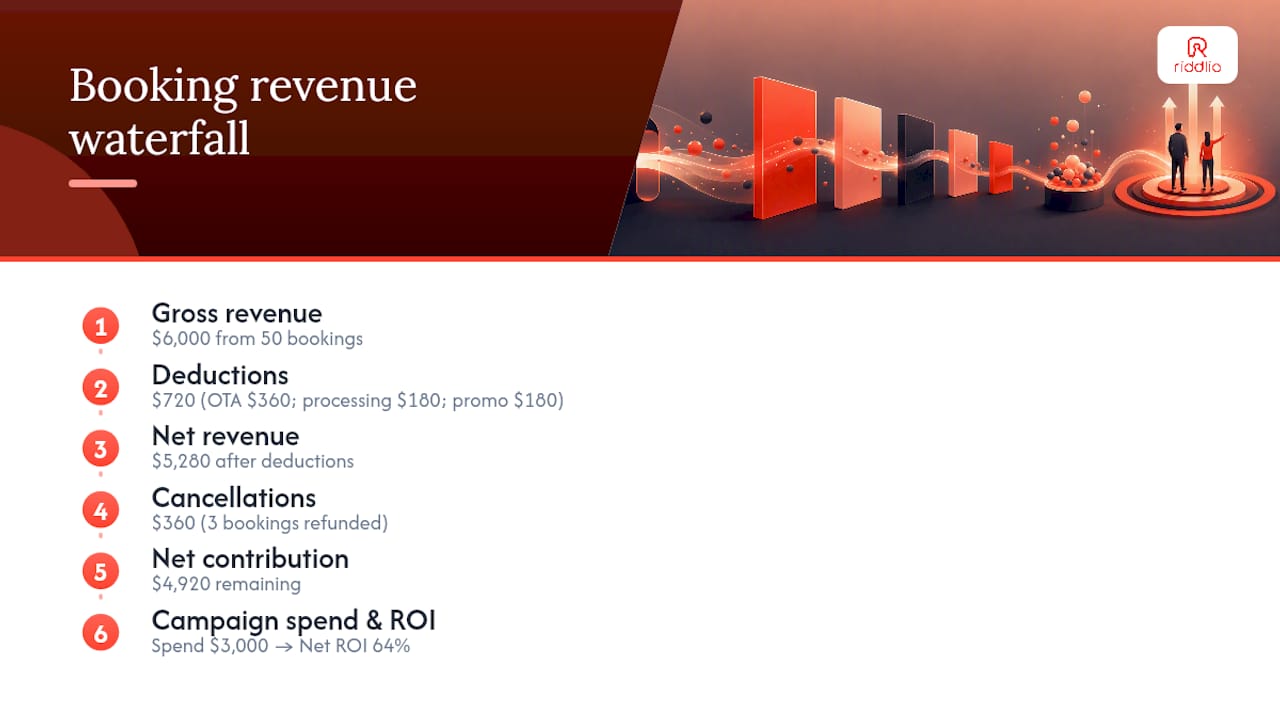
Net ROI = ($4,920 − $3,000) / $3,000 × 100 = 64%. Respectable, but a long way from the 100% the gross figure implied.
A net ROI comfortably above your cost of capital signals room to scale spend cautiously while watching CPA for creep. A number near breakeven suggests testing new creative or audiences before committing more budget. A negative net ROI, even with strong-looking gross revenue, is your cue to pause and investigate deductions before pulling the whole campaign.
What booking measurement gets wrong most often
The mistake I see repeated across booking-driven businesses isn’t a lack of data. It’s an abundance of the wrong data, dashboards full of clicks and impressions dressed up as performance, while the metric that actually pays the bills, net contribution per booking, sits buried in a separate finance spreadsheet nobody cross-references against campaign reports.
The fix isn’t complicated, but it does require discipline most marketing teams skip under deadline pressure: connect the booking feed to the ad platform before launch, not after the first report looks confusing. A platform built specifically for venues, like Riddlio’s booking data integration and automated SMS reminders, removes a lot of that manual reconciliation work by tying booking-level detail directly to the operational side, cutting into the no-show and cancellation numbers that otherwise quietly erode reported ROI.
Test small before you scale. A two-week holdout on one channel tells you more about causality than three months of last-touch attribution ever will.
— Iosif Beraru
Where to go for deeper reading on campaign ROI
For a closer look at how ROI, ROAS and CLV differ in practice, Oracle’s marketing ROI guide is a solid technical reference. Sojern’s destination marketing ROI framework covers incrementality testing and three-tier scorecards in more depth than most booking-specific guides attempt. For attribution model comparisons, Usercentrics’ MTA versus MMM breakdown is worth bookmarking, and Google’s own documentation on Performance Max channel reporting is essential if PMax makes up any meaningful share of your ad spend.
Sources
- AnyRoad blog — marketing roi calculator
- Sojern — a complete guide to proving destination marketing ROI
- HubSpot knowledge — analyze your campaign ROI