Occupancy rate is the percentage of your available game slots or player seats actually filled over a given period, calculated as booked slots (or seats) divided by available slots (or seats), multiplied by 100. The one-line formula is: Occupancy Rate = (Booked Seats ÷ Available Seats) × 100. On its own it’s a decent health check, but pair it with Riddlio’s favourite yield metric, revenue per available room-hour (RevPATS), and the worked examples below, and you get a number you can actually act on.
TL;DR:
- Segment occupancy data by at least four dayparts to reveal underpricing opportunities in low-demand periods masked by average figures.
- Rely on revenue per available room-hour (RevPATS) instead of occupancy alone, as it accounts for actual revenue generation regardless of booking discounts or seat filling.
- Automate data collection and tracking with systems that extract booking, capacity, and no-show information directly from platforms to ensure accuracy and real-time insights.
- Adjust for cancellations and last-minute changes by recording seat availability at session time rather than booking, preventing inflated occupancy metrics.
- Use at least two full quarters of segmented occupancy and RevPATS data to validate capacity expansions or scheduling decisions, avoiding reactions based on short-term fluctuations.
Table of Contents
- Occupancy rate formula: step-by-step with a worked example
- Why blended occupancy hides your real problem
- What is RevPATS and why does it beat occupancy alone?
- What data do you need to calculate this properly?
- Common mistakes that skew your occupancy numbers
- Impact of cancellations and last-minute changes
- Using occupancy trends to forecast and plan capacity
- How Riddlio applies these numbers in practice
- Automate your occupancy tracking so the numbers are never guesswork
- Sources
Occupancy rate formula: step-by-step with a worked example
Two versions of the same formula matter here. The session-based occupancy rate is booked sessions divided by available sessions, times 100. The seat-based version, which most operators find more useful, is booked seats divided by total seat capacity across all sessions, times 100. Seat-based occupancy catches something session-based math misses entirely: a “full” session with two players in an eight-seat room.
Here’s a worked week for a single room:
- The room runs multiple sessions across the week, each with an 8-seat capacity, giving a number of available seats.
- Bookings fill 96 seats across those sessions, but 3 seats are no-shows who never turned up on the day.
- Session-based occupancy counted the sessions with bookings, which can be misleading about revenue.
- Seat-based occupancy, counting only seats that actually walked through the door, was about 58%.
Partially filled sessions still count as “run” for cost purposes (staff, power, reset), but for occupancy math, put every booked seat in the numerator and every available seat in the denominator, regardless of how the room was distributed across sessions. Cancelled bookings that free the seat back up before the cut-off should exit the numerator; no-shows should not, because the seat was still unavailable to anyone else.
Why blended occupancy hides your real problem
A single average across your whole week is close to useless for decision-making. Split it into at least four dayparts: weekday daytime, weekday evening, weekend daytime, and weekend evening, because demand, staffing, and pricing power differ wildly between them.
Here’s the classic trap. A room posts moderate occupancy for the month, which sounds mediocre and prompts a discount campaign. Segment it and the picture flips: weekend evenings are running at high occupancy, a clear signal of underpricing, while weekday daytime has very low occupancy.
Segmentation only works if you actually look at it on a schedule:
- Run a weekly dashboard split by room and daypart, not a single occupancy number for the venue.
- Check monthly trends to separate a genuine slump from normal seasonal noise.
- Flag any daypart holding above 80% occupancy for three or more consecutive weeks as a pricing opportunity, not a win to celebrate.
Pro Tip: Build a simple occupancy heatmap, room down one axis, daypart across the other, coloured by percentage filled. Recurring cold cells jump out in seconds, faster than scanning rows of numbers ever will.
What is RevPATS and why does it beat occupancy alone?
Revenue per available room-hour, often shortened to RevPATS (revenue per available time slot), is total room revenue divided by total available room-hours for the same period. It’s the metric PulseRevOps recommends as the single best yield number, because unlike occupancy, it can’t be inflated by slashing prices to fill seats.
Here’s why that distinction matters in practice:
- Room A runs at approximately 70% occupancy charging around $35 per player in an 8-seat room, generating notable RevPATS across a 60-minute slot.
- Room B runs at higher occupancy but charges a lower price per player, resulting in lower RevPATS than Room A.
- Room A looks worse on the occupancy report and better on the metric that actually pays the rent.
RevPATS calculated at industry-average pricing near $35 per player and eight-seat capacity gives you a rough benchmark, but always localise to your own ticket price. Track RevPATS monthly, per room, and per daypart, and compare it against the same month last year to strip out seasonal noise before you draw conclusions.
What data do you need to calculate this properly?
Accurate occupancy and RevPATS numbers depend on clean inputs, not clever formulas. Nine fields cover almost everything:
- Room ID and slot start/end time
- Session duration in minutes
- Booked seats per session
- Total capacity per session
- Price per player (or per booking)
- Booking source (website, phone, walk-in, third-party)
- Booking status (confirmed, cancelled, completed)
- No-show flag, tracked separately from cancellations
- Reset time between sessions, if you’re calculating total room-hours
Available slots come from operating hours divided by slot cadence (session length plus reset time); total room-hours come from operating hours multiplied by the number of rooms running that schedule. A basic spreadsheet with one row per session covers this, but manual entry breaks down fast once you’re running multiple rooms across a busy weekend. Automating the export from your booking platform removes the transcription errors that quietly corrupt these numbers, and it’s one reason daily booking and conversion reporting should track no-shows and cancellations as distinct fields, not lumped together.
Common mistakes that skew your occupancy numbers
Most bad occupancy figures trace back to one of a handful of repeat offenders:
- Blending all rooms and dayparts into one average, which erases the exact patterns you need to see. Fix: always report segmented figures first, blended second.
- Using inconsistent capacity numbers across rooms with different seat counts. Fix: normalise capacity per session before you calculate anything.
- Ignoring no-shows entirely, which inflates occupancy above what actually walked in. Fix: subtract no-shows from the numerator, and report the no-show rate alongside occupancy.
- Miscounting partial fills as either “full” or “empty” sessions. Fix: always calculate seat-based occupancy, not just session-based.
Spot-check your numbers monthly against raw booking exports. A five-minute audit catches most of these before they influence a pricing decision.
Impact of cancellations and last-minute changes
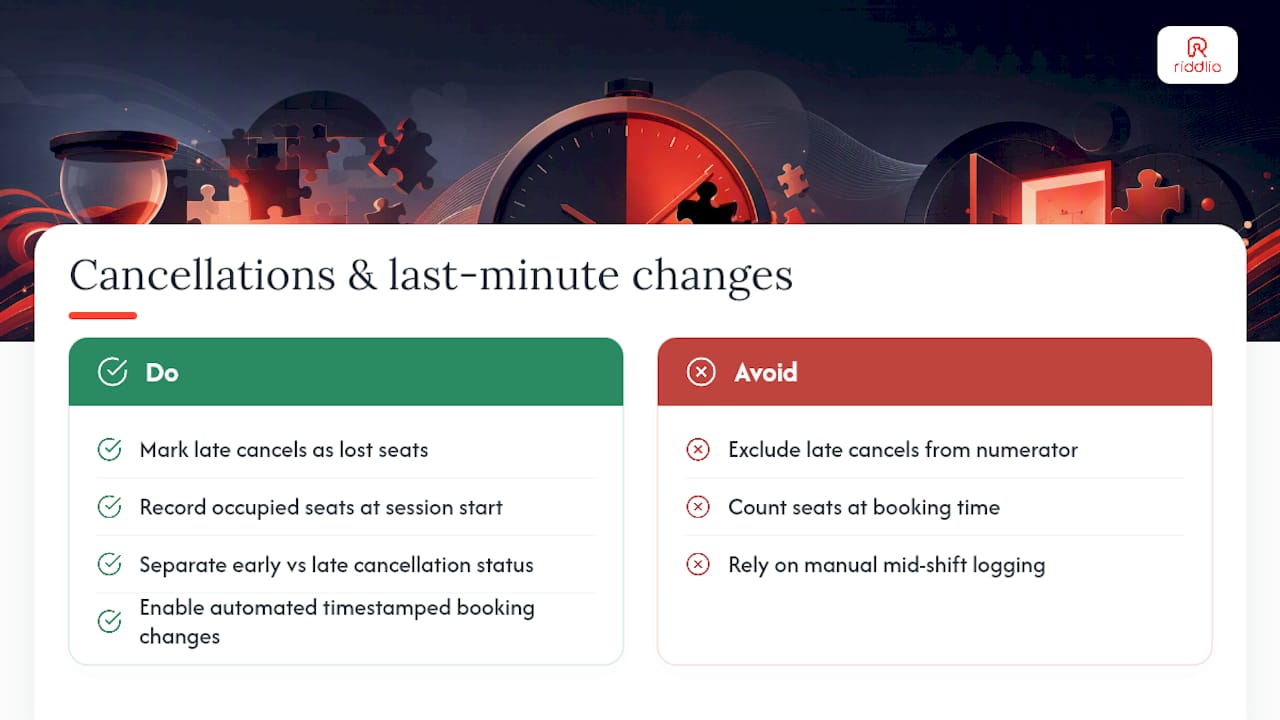
Cancellations and last-minute changes distort occupancy in two opposite directions, depending on timing and how you record them. A cancellation that happens well before the cut-off and gets rebooked shouldn’t touch your numerator at all, since the seat genuinely returns to available inventory. The problem is late cancellations, the ones that happen too close to the session to resell the seat.
Treat a late cancellation the same way you treat a no-show: the seat was booked, then abandoned, and nobody else could take it. If you strip late cancellations out of the numerator entirely, your occupancy rate looks artificially healthy while your actual revenue tells a different story. The fix is a status field that separates “cancelled early, reopened” from “cancelled late, seat lost,” so your reporting reflects what genuinely happened to that inventory.
Last-minute booking changes, like a group shrinking from six players to four after confirmation, need the same discipline. Recalculate seats occupied at the moment the session runs, not at the moment it was booked. If your booking platform doesn’t timestamp these changes automatically, you’re relying on staff to update a spreadsheet mid-shift, which is exactly the kind of manual step that produces quietly wrong monthly totals. This is where automated booking data capture earns its keep, because it timestamps every change rather than depending on someone remembering to log it later.
Using occupancy trends to forecast and plan capacity
A single month of occupancy data tells you what happened. A rolling twelve-month view, segmented by room and daypart, tells you what’s coming. Weekend evening occupancy that’s climbed steadily for three consecutive quarters is a signal to add a slot, extend hours, or open a second room in that window, not just a nice trend line to admire.
Forecasting from occupancy trends works best when you compare like with like. Stack this month’s weekday-evening occupancy against the same month last year rather than against last month, because escape rooms carry strong seasonal patterns tied to school holidays, tourism cycles, and even local weather. A dip in January that mirrors last January isn’t a crisis; a dip that breaks the historical pattern is worth investigating.
Capacity planning decisions, like adding a new room, extending trading hours, or hiring another game master, should be backed by at least two full quarters of segmented occupancy and RevPATS data pointing the same direction. One strong weekend doesn’t justify a new theme build costing tens of thousands of dollars.
How Riddlio applies these numbers in practice
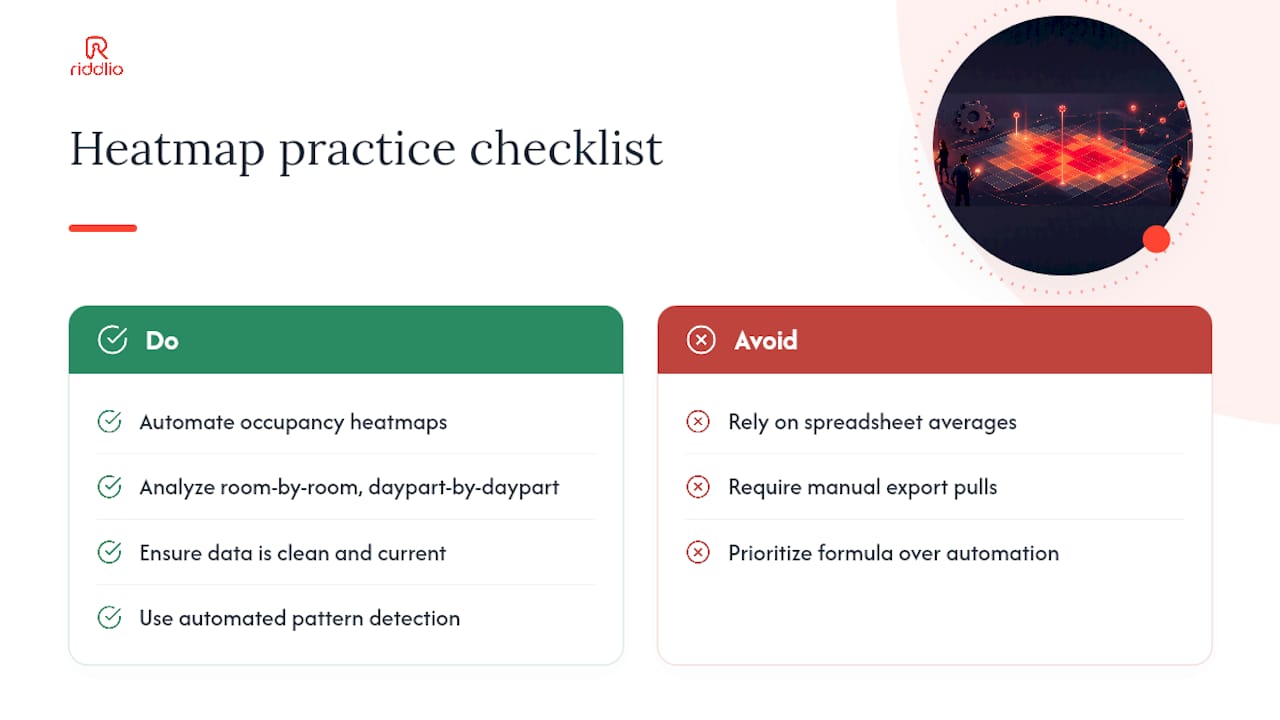
We built our occupancy heatmaps because spreadsheet averages kept hiding the exact problems operators needed to see, room by room, daypart by daypart, without anyone manually pulling exports. Automated calculation matters more than the formula itself, because a formula only helps if the underlying data is clean and current. Iosif Beraru covers the mechanics of pattern detection in more depth in our guide to occupancy heatmaps.
— Iosif Beraru
Automate your occupancy tracking so the numbers are never guesswork
Every calculation in this article depends on clean data arriving without a staff member manually re-entering it into a spreadsheet at midnight. Riddlio pulls booking, capacity, and no-show data straight from your calendar into live analytics, so segmented occupancy and RevPATS update automatically instead of waiting for a monthly export.

The features map directly onto what this article recommends: online booking exports feed your room-ID and slot data without manual entry, dynamic pricing lets you test peak premiums and off-peak discounts on the segments that need them, and automated SMS reminders cut the no-shows that quietly inflate your booked-seat count. Fewer manual entries means fewer calculation errors, and faster access to segmented data means you catch a sliding daypart before it costs you a quarter of revenue. If you’re currently reconstructing occupancy from a spreadsheet each month, see how Riddlio’s booking system handles it automatically instead.
Sources
The formulas and benchmarks in this article draw on a handful of sources worth reading directly. PulseRevOps’s escape room KPI guide covers daypart segmentation and RevPATS in more technical depth. Beancount breaks down per-room P&L, including labour and depreciation alongside revenue. RationalGo’s booking report guide explains how to structure daily conversion and no-show reporting. For operators managing listings beyond escape rooms, Hospitality Lens’s guide to refreshing underperforming listings offers useful conversion-rate context for low-occupancy dayparts.
- What are the most important KPIs every escape room… in 2027?
- Daily Escape Room Booking and Conversion Report Generator | RationalGo App Builder | RationalGo