AI demand forecasting applies machine learning models to historical and real-time data to generate forward-looking demand signals, replacing or augmenting manual planning cycles. The immediate payoff is concrete: fewer stockouts, lower excess inventory, and planning cycles that compress from days to hours. According to IBM, organisations that deploy AI-augmented forecasting report meaningful reductions in forecast error and product unavailability compared with traditional statistical methods.
Before you read further, run through this three-point starter checklist:
- Data readiness: Do you have at least 18–24 months of clean, timestamped sales or booking history at the SKU-location level?
- Pilot scope: Can you isolate a manageable slice of 50–200 SKUs or time slots where forecast error is already measurable?
- Success metric: Have you defined a short-term target, such as reducing weekly stockouts by a set percentage or improving Mean Absolute Percentage Error (MAPE) by a defined margin within 90 days?
If you can answer yes to all three, you are ready to start a pilot.
Key takeaways
AI demand forecasting delivers its strongest results when clean data, a clear business metric, and human-AI collaboration are in place before the model is built.
| Point | Details |
|---|---|
| Start with data quality | Clean, timestamped SKU-location history is more valuable than a sophisticated algorithm applied to patchy data. |
| Use hybrid methods for sparse data | Combining a statistical baseline with an ML correction layer outperforms pure deep learning for intermittent or low-volume SKUs. |
| Include Australian demand drivers | BOM weather feeds, state school-holiday calendars, and EOFY patterns materially affect forecast accuracy for Australian operations. |
| Measure forecast value added | Always compare the AI model against a naïve baseline; if it does not beat the baseline on FVA, diagnose before scaling. |
| Riddlio as a forecasting foundation | Riddlio centralises booking data, reduces no-shows via automated reminders, and supports dynamic pricing, giving venue operators a ready-made data pipeline for demand forecasting. |
Table of Contents
- Why AI demand forecasting matters for Australian supply chains
- How an AI demand-forecasting pipeline works
- Which AI methods should you use for demand forecasting?
- What data do you need, and how do you integrate it?
- How do you measure and validate forecast quality?
- A practical implementation roadmap for Australian businesses
- What are the main risks, and how do you mitigate them?
- AI demand forecasting in practice: escape room and entertainment venues
- Step-by-step adoption roadmap for Australian businesses
- AI demand forecasting deployments in Australian supply chains
- The gap between AI forecasting’s promise and what actually matters
- Riddlio gives venue operators a forecasting head start
- Sources
Why AI demand forecasting matters for Australian supply chains
The case for AI in demand planning comes down to four compounding advantages: accuracy, speed, scalability, and scenario planning. Classical statistical methods like ARIMA handle stable, high-volume series reasonably well. They struggle with the irregular, event-driven demand patterns that define modern Australian retail and logistics, where a single State of Origin fixture or a Brisbane school-holiday week can shift weekly demand by a factor that no moving average captures cleanly.
Oracle’s overview of AI demand forecasting describes how AI unifies internal datasets (sales history, promotions, pricing) with external signals (weather, events, macroeconomic indicators) to produce more comprehensive forecasts and automate workflows that previously required large planning teams. That automation matters at scale: a retailer managing 50,000 SKUs across 200 stores cannot manually review every forecast each week.
Industry and vendor sources report that AI-augmented forecasting can reduce forecast errors and lower stockout rates compared with purely statistical baselines, though actual gains vary by data quality, category, and implementation maturity. Predictive analytics in retail case examples show major retailers using hyper-local external signals, including weather and event calendars, to reduce lost sales from unavailability.
Australian-specific demand drivers worth building into any model:
- State school-holiday schedules (which differ by state and shift year to year)
- End of Financial Year (EOFY) spending patterns in June, particularly in B2B and technology categories
- Bureau of Meteorology (BOM) weather feeds affecting seasonal categories like apparel, hardware, and food
- Major sporting events: AFL finals, NRL finals, the Australian Open, and State of Origin series
- Local festivals and public holidays that vary by state (Melbourne Cup Day, Adelaide Fringe, and similar)
These drivers map directly to operational KPIs. Better fill rates reduce lost revenue. Lower excess inventory frees working capital. Faster planning cycles let procurement teams respond to disruptions, whether a port delay at Port Botany or a sudden demand spike from a viral social trend, before the damage compounds.
How an AI demand-forecasting pipeline works
A production-grade AI forecasting pipeline has six stages. Understanding each one helps planners know where to invest effort and where most implementations break down.
- Data ingestion: Pull sales history, inventory levels, promotional calendars, and external feeds into a centralised data store. Timestamps and SKU-location keys must be consistent across every source.
- Feature engineering: Transform raw data into model inputs. This is where domain knowledge earns its keep: creating lag features (sales 7, 14, 28 days prior), rolling averages, promotional flags, day-of-week indicators, and external variables like temperature or event proximity.
- Model training: Fit the chosen algorithm on historical data, using time-based splits to avoid look-ahead bias.
- Inference: Generate forward-looking forecasts at the required granularity (daily, weekly, by SKU-location).
- Explainability layer: Produce human-readable outputs showing which drivers moved the forecast. Without this, planners distrust the model and override it constantly.
- Deployment and monitoring: Push forecasts into replenishment or planning tools, track model drift, and trigger retraining when performance degrades.
A practical cadence for most Australian retailers or venue operators: daily inference for replenishment decisions, weekly parameter updates as new sales data arrives, and a monthly model review where a planner checks for systematic bias or drift.
Oracle notes that AI systems can automate the ingestion of diverse internal and external datasets, which means the manual effort shifts from data wrangling to model governance and exception handling.
Common data inputs include:
- Internal: POS transaction data, inventory snapshots, promotional calendars, pricing history, returns, lead times, and SKU master data (category, brand, size, weight)
- External: BOM weather feeds, state school-holiday calendars, event schedules, web traffic, social trend indices, and macroeconomic indicators like consumer confidence
A concrete operational example: a forecast output of 340 units for a given SKU in week 12 maps directly to a reorder quantity when you subtract current on-hand stock and apply your safety stock formula. For a venue, the same logic applies: a forecast of 28 booked slots out of 40 available in a given week triggers a targeted promotion to fill the gap, not a blanket discount.
Pro Tip: Build your explainability layer before you go live, not after. Planners who cannot see why a forecast moved will override it on instinct, and those overrides are the single biggest source of forecast value erosion in the first six months of a deployment.
Which AI methods should you use for demand forecasting?
Method selection is where many implementations go wrong. Teams default to the most complex model available rather than the one best suited to their data.
Classical time-series (ARIMA, ETS): Reliable for stable, high-volume series with clear seasonality. Highly explainable. Struggle with external drivers and non-linear patterns. Low compute cost.
Tree-based ML (XGBoost, Random Forest): Handle non-linear relationships and external features well. Require more data preparation but are relatively fast to train and interpret. Good default choice for mid-volume SKUs with promotional activity.
Gradient boosting (LightGBM, CatBoost): Often the workhorse of retail forecasting competitions. Strong performance on tabular data, handles missing values gracefully, and trains quickly. The practical first choice for most supply-chain teams moving beyond ARIMA.
Deep learning (LSTM, Transformer-based models): Powerful for very long series with complex temporal dependencies. Require large data volumes, significant compute, and specialist expertise. Explainability is harder. Not always the best choice for SKU-level retail data.
A literature review published in Procedia CIRP via ScienceDirect recommends selecting methods based on data characteristics rather than defaulting to deep learning, and advocates hybrid statistical/ML approaches for supply-chain contexts where data is often intermittent and sparse.
Pro Tip: For slow-moving or intermittent SKUs, a hybrid model that combines a statistical baseline (Croston’s method or ETS) with an ML correction layer typically outperforms a pure deep-learning model. The statistical component handles the sparse signal; the ML layer captures promotional and seasonal lifts.
Enterprise vendors operating in this space include IBM (Watson-based AI offerings), C3.ai (enterprise AI platform with supply-chain modules), and Antuit.ai (bespoke AI-enabled sales forecasting used by major retailers for store-level inventory decisions). Each takes a different approach to model architecture and integration depth.
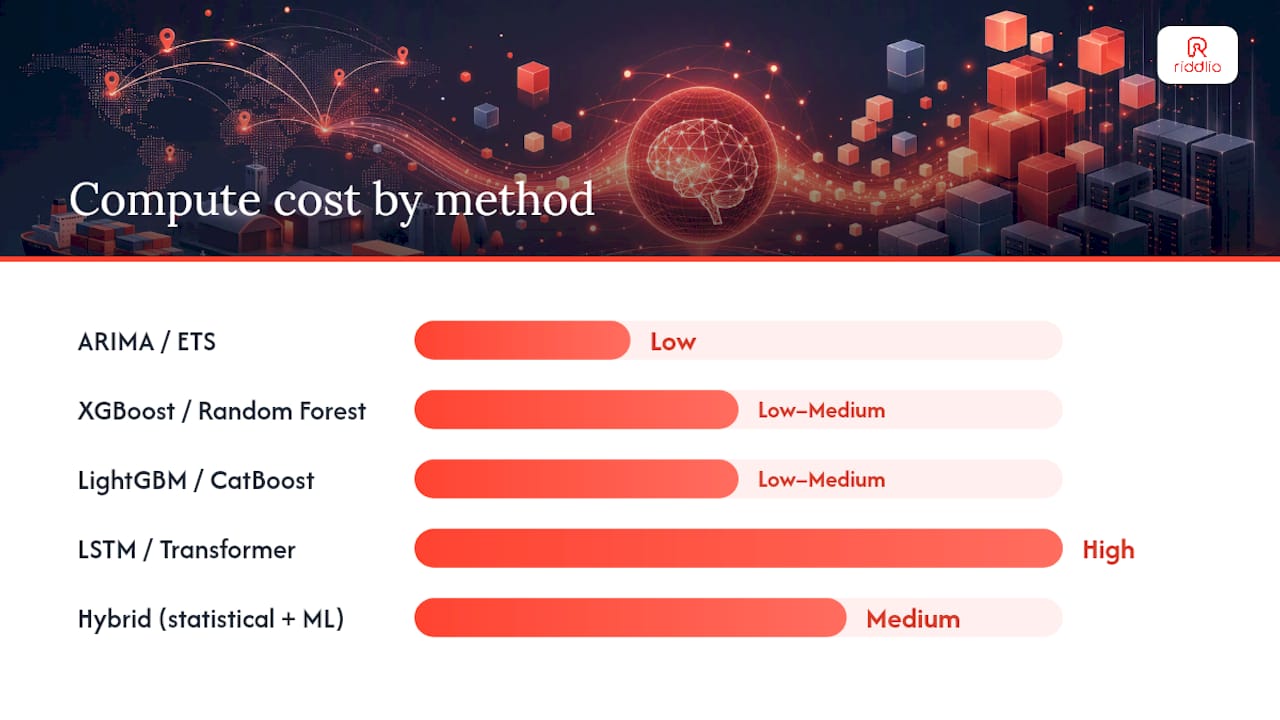
| Method | Best for | Data need | Explainability | Compute cost |
|---|---|---|---|---|
| ARIMA / ETS | Stable, high-volume series | Low | High | Low |
| XGBoost / Random Forest | Mid-volume, promotional SKUs | Medium | Medium | Low–Medium |
| LightGBM / CatBoost | Broad retail portfolios | Medium | Medium | Low–Medium |
| LSTM / Transformer | Long series, complex patterns | High | Low | High |
| Hybrid (statistical + ML) | Intermittent, sparse SKUs | Medium | Medium–High | Medium |
What data do you need, and how do you integrate it?
Data quality is the single biggest predictor of forecast quality. A sophisticated model trained on dirty data will underperform a simple model trained on clean data, every time.
Core internal data sources:
- POS or booking transaction history (minimum 18 months, ideally 3 years)
- Inventory levels and replenishment records
- Promotional and markdown calendars with start/end dates and discount depth
- Pricing history
- Returns and cancellations
- Supplier lead times and order history
- SKU master data: category, subcategory, brand, size, weight, lifecycle stage
External signals worth integrating for Australian operations:
- Bureau of Meteorology (BOM) historical and forecast weather data, available via the BOM Data Services API
- State school-holiday calendars (published annually by each state education department)
- Public holiday schedules by state
- Major event calendars (AFL, NRL, cricket, major concerts)
- ABS consumer confidence and retail trade indices
- Google Trends for category-level demand sensing
Integration checklist for an Australian rollout:
- Standardise timestamps to a single timezone (AEST or AEDT with daylight saving handled explicitly).
- Align SKU codes and location identifiers across ERP, POS, and WMS systems.
- Define a schema for each data source and document it.
- Run automated quality checks: missing values, outliers, duplicate records, and negative inventory.
- Establish data lineage so you can trace any forecast back to its inputs.
- Apply governance controls consistent with the Australian Privacy Principles (APPs) under the Privacy Act 1988, particularly for any customer-level data used in demand signals.
EOFY patterns in Australia deserve special attention. Demand in technology, office supplies, and business services often spikes sharply in May and June, then drops in July. Models trained without an explicit EOFY flag will systematically under-forecast in May and over-forecast in July.
How do you measure and validate forecast quality?
Choosing the right metric matters as much as choosing the right model. The wrong metric can make a poor forecast look acceptable.
Key metrics and when to use them:
- MAPE (Mean Absolute Percentage Error): Widely used, easy to communicate to non-technical stakeholders. Breaks down for SKUs with near-zero demand (division by zero) and is asymmetric, penalising under-forecasts more than over-forecasts.
- MAE (Mean Absolute Error): More robust for intermittent demand. Easier to interpret in absolute units (cases, bookings, dollars).
- RMSE (Root Mean Squared Error): Penalises large errors heavily. Useful when a single large miss is more costly than several small ones.
- Bias: Measures systematic over- or under-forecasting. A model with low MAPE but high bias will consistently drive either excess stock or stockouts.
- Forecast Value Added (FVA): Compares the AI model’s accuracy against a naïve baseline (e.g., last year’s actuals). If the model does not beat the naïve baseline, it is not adding value.
- Service level and fill rate: The business-facing metrics that ultimately matter. Track these alongside statistical metrics to confirm that model improvements translate to operational outcomes.
Backtesting approach:
Use time-based splits, not random splits. A random split allows the model to train on future data, which inflates apparent accuracy. A rolling-window backtest simulates real deployment: train on months 1–18, test on months 19–21, then roll forward.
For a pilot, run a simulated reordering test: apply the model’s forecasts to your reorder logic and calculate what inventory levels and service levels would have been over the holdout period. That number is the business case for the board.
When comparing two models, check for statistical significance. A small improvement in MAPE over a 90-day holdout may not be meaningful if the confidence intervals overlap.
A practical implementation roadmap for Australian businesses
Moving from pilot to enterprise rollout requires discipline at each phase. Skipping phase one because the business is impatient is the most common reason AI forecasting projects stall.
Phase 1: Pilot (weeks 1–12)
- Select a SKU-location slice: 50–200 SKUs at one or two locations where forecast error is already tracked and the data is reasonably clean.
- Define a single success metric (e.g., reduce MAPE by 15% or reduce weekly stockouts by 20% over the holdout period).
- Build the data pipeline for that slice only. Do not attempt enterprise-wide integration in phase one.
- Train a baseline model (LightGBM or ETS) and an AI model. Compare both against a naïve baseline using FVA.
- Present results to stakeholders with the simulated reordering test output.
Phase 2: Expand (months 3–9)
- Segment the full SKU portfolio by volume and intermittency. Apply different model types to each segment.
- Operationalise forecast outputs: push them into your ERP or replenishment tool rather than exporting to spreadsheets.
- Train planning staff on how to read and override forecasts, and log every override for later analysis.
- Add external data sources (BOM weather, school holidays, event calendars) and measure the lift.
Phase 3: Scale (months 9–24)
- Roll out to all sites and SKU segments.
- Implement model governance: version control, retrain triggers, drift monitoring, and a documented escalation path when model performance degrades.
- Review the human-AI collaboration model. MIT Sloan Management Review finds that pairing human planners with AI outputs improves both forecast quality and organisational adoption, particularly when planners have a clear, structured process for reviewing and overriding model outputs.
Vendor selection criteria for Australian businesses:
- Native integrations with your ERP (SAP, Oracle, Microsoft Dynamics) and POS systems
- Explainability features that non-technical planners can use
- Australian data residency or compliance with the APPs
- Local support and SLA commitments in AEST business hours
- Transparent pricing model (per-SKU, per-user, or flat subscription)
- A published roadmap that includes agentic and generative AI capabilities, given that Bloomberg Intelligence forecasts the generative AI market to reach $2.3 trillion by 2032, with inference-driven demand growth accelerating through 2026
What are the main risks, and how do you mitigate them?
Most AI forecasting failures trace back to a small set of predictable problems. Knowing them in advance is half the battle.
Top risks and mitigations:
- Poor data quality: Garbage in, garbage out. Run automated quality checks before training, not after. Define data contracts with upstream systems.
- Look-ahead bias: Using future data in training inflates accuracy metrics and produces models that fail in production. Always use time-based splits.
- Overfitting: A model that memorises training data performs poorly on new data. Use cross-validation, regularisation, and a held-out test set the model never sees during training.
- Model drift: Demand patterns change. A model trained before COVID-19 will not handle post-pandemic behaviour well. Set monitoring thresholds and automatic retrain triggers.
- Lack of explainability: Planners who cannot understand a forecast will not trust it. Build SHAP values or feature-importance outputs into every model deployment.
- Organisational resistance: The biggest non-technical risk. Involve planners in the pilot design, show them the FVA results, and give them a structured override process so they feel in control rather than replaced.
Australian Privacy Principles (APPs) note: If your demand signals incorporate any customer-level data (purchase history, loyalty programme data, or booking records), you must comply with the APPs under the Privacy Act 1988. Aggregate or anonymise customer data before it enters the forecasting pipeline. Do not use individual customer identifiers as model features. Review your data handling practices with legal counsel if you are uncertain about scope.
Pro Tip: Always maintain a naïve statistical baseline model running in parallel with your AI model. It costs almost nothing to run, and it gives you an immediate guardrail: if the AI model’s error rises above the baseline’s error for three consecutive weeks, that is your retrain trigger.
AI demand forecasting in practice: escape room and entertainment venues
Appointment-based entertainment venues, including escape rooms, present a compact and instructive case for AI demand forecasting. The “SKU” is a room-time slot, the “location” is the venue, and the forecast horizon that matters most is four weeks out, which is when most promotional decisions need to be made.
A typical pilot for a multi-room escape room venue in Australia would use the following data inputs:
- Booking history by room and time slot (minimum 12 months)
- No-show and cancellation rates by booking channel
- Promotional history (discounts, voucher campaigns, group offers)
- Local event calendar (school holidays, public holidays, nearby sporting events)
- Weather data from BOM for the venue’s postcode
The venue metrics that matter most in this context:
- Fill rate: Booked slots as a percentage of available slots
- No-show rate: Percentage of bookings that do not arrive
- Revenue per slot: Average revenue across all room-time combinations
- Average booking lead time: How far in advance customers book (affects how early a forecast is actionable)
- Cancellation rate by channel: Online vs. walk-in vs. group bookings behave differently
A practical challenge for small venues is sparse data: a room that runs six sessions per day generates roughly 2,000 data points per year, which is thin for deep-learning models. Bayesian smoothing and Croston’s method for intermittent series handle this well. For promotional response, even a simple XGBoost model with a promotional flag and a school-holiday indicator will outperform a naïve baseline.
An integrated booking and analytics platform reduces implementation friction significantly. When bookings, cancellations, and no-shows are recorded in a single system, the data pipeline for forecasting is already half-built. Automated SMS reminders reduce no-show rates, which directly lowers the noise in the demand signal and makes forecasts more reliable.
Venue operators who centralise their booking data and automate customer communications before building a forecast model will find the modelling work far simpler. Clean, complete booking records are worth more than a sophisticated algorithm applied to patchy data.
Dynamic pricing is the natural downstream application: once you have a reliable four-week fill-rate forecast, you can set peak and off-peak pricing rules that act on the forecast signal automatically, filling low-demand slots without manual intervention.
Step-by-step adoption roadmap for Australian businesses
The phased roadmap in the implementation section above covers the technical sequence. This section adds the organisational and Australian-specific steps that determine whether a rollout succeeds.

Step 1: Appoint a forecast owner. Assign one person, typically a supply chain analyst or operations manager, who is accountable for model performance and the human-AI collaboration process. Without a named owner, no one monitors drift or investigates anomalies.
Step 2: Audit your data sources against the Australian context. Confirm you have BOM weather feeds, state school-holiday calendars for every state you operate in, and a clean promotional history. These three sources alone account for a large share of the explainable variance in Australian retail and venue demand.
Step 3: Run a 90-day pilot with a defined exit criterion. If the model does not beat the naïve baseline on FVA within 90 days, diagnose before expanding. The most common causes are insufficient history, missing promotional flags, or a timezone alignment error in the data pipeline.
Step 4: Operationalise before you scale. Push forecast outputs into your replenishment or scheduling tool before rolling out to additional sites. A forecast that lives in a spreadsheet is not an operational forecast.
Step 5: Review and retrain quarterly. Australian demand patterns shift with EOFY, school-holiday calendars, and weather seasonality. A model that is not retrained at least quarterly will drift. Set a calendar reminder.
AI demand forecasting deployments in Australian supply chains
Australian businesses across retail, logistics, and entertainment have moved from pilot to production with AI forecasting, with results that reflect both the opportunity and the complexity of the local market.
Woolworths Group has publicly discussed its use of AI and machine learning for demand forecasting and replenishment, incorporating weather data and promotional signals to reduce waste and improve on-shelf availability across its supermarket network. The scale of the challenge, tens of thousands of SKUs across hundreds of stores, makes manual forecasting impractical and gives AI a clear structural advantage.
In logistics, Australia Post has applied predictive analytics to parcel volume forecasting, using historical volume data, e-commerce trends, and seasonal patterns to plan staffing and network capacity.
In the entertainment and venue sector, operators managing multiple escape room or immersive experience venues have begun using booking platform data to forecast weekly fill rates and trigger promotional activity. The immersive experience booking software category is a natural fit for AI forecasting because the data is structured, the SKU set is small, and the operational decisions (pricing, staffing, promotions) are directly tied to the forecast.
The common thread across these deployments is not the sophistication of the model. It is the quality of the data pipeline and the clarity of the business decision the forecast is meant to support.
The gap between AI forecasting’s promise and what actually matters
AI demand forecasting is genuinely powerful, but the industry conversation around it tends to oversell the model and undersell the plumbing. Most forecasting projects that fail do not fail because the algorithm was wrong. They fail because the data pipeline was broken, the planners were not involved, or the forecast outputs were never connected to an actual operational decision.
The organisations that get the most from AI forecasting are not the ones with the most sophisticated models. They are the ones with the cleanest data, the clearest success metrics, and a planner who reviews the model’s outputs every week and knows when to override them. MIT Sloan’s research on human-AI collaboration makes this point directly: the combination of human expertise and AI output consistently outperforms either alone.
For Australian supply chain leaders, the practical priority this quarter is not selecting the best algorithm. It is running a data audit, identifying the SKU-location slice where forecast error is highest and the data is cleanest, and starting a 90-day pilot with a naïve baseline as the comparison point. That is the work that produces a real business case.
Riddlio gives venue operators a forecasting head start
Escape room and entertainment venue operators face the same forecasting challenge as any supply chain team, but with one advantage: the data is already structured. Every booking, cancellation, and no-show is a timestamped demand signal.
Riddlio brings bookings, payments, automated reminders, and analytics into one platform, so the data pipeline that a forecasting model needs is already built. Automated SMS reminders cut no-show rates, which reduces noise in your demand signal. Dynamic pricing tools let you act on forecast outputs immediately, filling low-demand slots without manual discounting.
Exportable booking data feeds directly into any forecasting model or analytics tool you choose to run alongside the platform.
For venue operators ready to move from gut-feel scheduling to data-driven capacity planning, start with Riddlio’s booking and analytics platform and use the clean, centralised data it produces as the foundation for your first forecasting pilot.
Sources
The sources below are the primary references used in this guide. Each is worth reading in full for deeper technical or strategic context.
- What is AI demand forecasting? | IBM
- AI in Demand Forecasting: Overview, Use Cases, & Benefits
- Pair people and AI for better product demand forecasting | MIT Sloan Management Review
- Predictive analytics in retail & ecommerce